The growth of America’s leading home improvement retailers continues to reaffirm the growing consolidation among a handful of key players
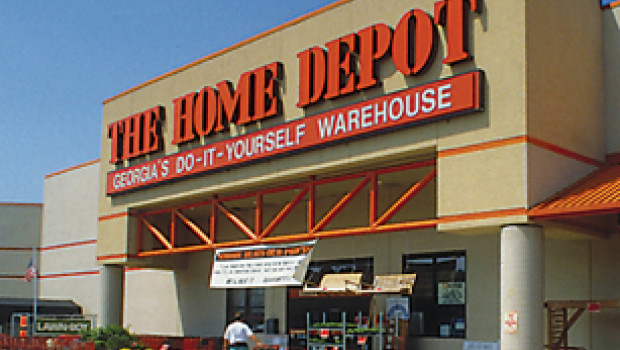
These two retailers dominate the DIY scene in the U.S. Home Depot has almost 1,700 stores and sales approaching $ 65 billion (€ 52 billion) Lowe’s, with sales of $ 30.8 billion (€ 24.8 billion) generated by approximately 1,000 stores, is aggressively opening stores alongside Home Depot in major centres such as New York, Atlanta and Chicago.
The number-three retailer is Menard’s, a privately owned chain of 187 stores located in nine Mid-Western states. Considered the incumbent in these areas, Menard’s is bracing as more and more competitive big boxes begin opening up in its markets.
Meanwhile, the independents have remained strong, collectively increasing sales. Ace’s net income last year increased 22.7 per cent to $100.7 million (€ 81.2 billion) on wholesale sales of $ 3.16 billion (€ 2.55 billion, up 4.3 per cent over 2002), while its sales at retail top the $13-billion mark (€ 10 billion).
Retail sales in $ billion
Change in per cent
Stores
Home Depot
64.8
11
1,707
Lowe's
30.8
15
925
Ace Hardware
13.0
-
5,027
Truserv
10.5
-
6,200
Do-it Best
9.0
-
4,500
Menard's
6.5
6.6
187
Sherwin-Williams
3.5
5.1
2,688*
Stock Building Supply
2.77**
(7.8)
222
84 Lumber
2.5
15
453
Builders First Source
1.75
10
73
*Stores in the U.S., Canada and Mexico. Sherwin-Williams also operates about 60 stores in other countries, whose sales are not included in its total revenue.
**Stock’s numbers are for the fiscal year ended July 31, 2003.
Source: Hardlines (www.hardlines.ca)

 Menü
Menü


