Menü
Menü


The data available annually from the National Retail Hardware Association on the development of the hardware/DIY trade in the USA can provide benchmark information for retail comparisons
In the United States hardware and related products are sold in many different types of stores. The three primary retail channels are conventional hardware stores, home centers and DIY lumberyards (building material retailers). While they all sell many of the same products, their operational costs and performance vary widely.
Each year the National Retail Hardware Association (NRHA) conducts a cost-of-doing-business survey. Although the following statistics, which are based on information reported by approximately 1 000 dealers, can provide interesting benchmark data, they should not be projected to indicate overall industry sales.
DIY lumberyards have a more rapid stockturn than hardware stores.
A look at hardware stores
Hardware outlets traditionally have had the lowest average sales per store, the highest gross margins (but also the highest expenses), as well as the lowest rate of stock turnover.
They are the “convenience outlets” of the hardlines retail scene, but unlike convenience food stores, they carry a tremendous number of stock-keeping units which slows their turnover. They are the problem-solving retailers serving the consumer community, carrying lots of repair parts and fix-it items as well as exciting new tools, stylish housewares and hardware, etc. Their average sale is far below that of the other two types of retailers since they carry fewer big-ticket items.
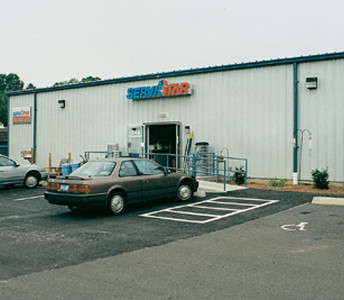
The average size of reporting stores is around 750 m², relatively unchanged over the last four years. In major cities there are hundreds of far smaller hardware stores, but in suburban areas and smaller towns 750 m² would be quite typical.
Sales were essentially flat in 2001 at US $ 1 135 812 on average. Fortunately inventory was reduced on average by five per cent. This may well be a tribute to the gradual computerisation of retailers working together with their primary wholesalers.
A look at DIY lumberyards
DIY lumberyards generate higher sales per m2 of covered sales area and per employee than the hardware stores. They operate with the lowest gross margin and turn their inventory at a very high rate.
The stores are usually situated in outlying locations because they need lots of land and prime retail space is too expensive and unneeded. Their customers are willing to drive a little greater distance for their larger purchases. They realise there will be less variety of products compared to a hardware store or home center, but they know the “basics” will be there in tools, etc. With fewer skus and customers who buy in larger quantities, average sales and store stockturns are both naturally higher.
Productivity
(.pdf download)
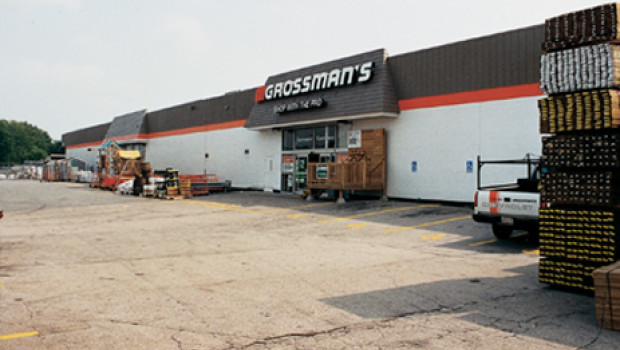
These stores do some consumer business, though it often is less than 30 per cent of total sales. They averaged sales floors of about 670 m² plus lots of outside storage areas and sheds for lumber. Reporting stores’ sales averaged US $ 4.6 mio. Inventory held quite flat with previous years.
As the following chart indicates, average sales are much higher than that of the other two retail groups, reflecting their concentration of business with builders, contractors and tradesmen.
A look at home centers
Home centers fit between hardware stores and DIY lumberyards. They operate with margins somewhat higher than the latter, but substantially below those of traditional hardware stores. They turn their stocks faster than hardware stores, too. They enjoy higher average sales because their larger stores permit them to stock larger items such as building materials, cabinets of all kinds and bathroom fixtures. With bigger stores and bigger sales volumes, they tend to promote more heavily and more often and thus seek to create sales rather than rely on consumer “needs”.
Operational data
(.pdf download)
The reporting home centers also had a flat sales year in 2001, but unfortunately increased their inventory by 4.5 per cent. The average size of reporting stores was almost 1 300 m². While industry attention focuses on the three big chains, there are still thousands of smaller home centers. Sales for reporting stores averaged US $ 3.6 mio.
Focus on inventory management
Perhaps the most meaningful statistic is the GMROI, which stands for Gross Margin Return On Inventory. This measures a retailer’s effectiveness in controlling gross margin, sales and inventory management. The figure is reached by multiplying gross margin by sales divided by inventory. For DIY lumberyards, as an example, which has the lowest margin of the three types of retailers, GMROI is highest at $ 1.85. The number means that they generated $ 1.85 for every dollar invested in inventory, which is a store’s biggest investment.
The average size of the reporting hardware dealers is around 750 m².
This is because the DIY lumberyards do a better job of managing (turning) their inventory. GMROI has helped the American hardware industry focus less on gross margin and more on inventory management.
Each year the National Retail Hardware Association (NRHA) conducts a cost-of-doing-business survey. Although the following statistics, which are based on information reported by approximately 1 000 dealers, can provide interesting benchmark data, they should not be projected to indicate overall industry sales.
DIY lumberyards have a more rapid stockturn than hardware stores.
A look at hardware stores
Hardware outlets traditionally have had the lowest average sales per store, the highest gross margins (but also the highest expenses), as well as the lowest rate of stock turnover.
They are the “convenience outlets” of the hardlines retail scene, but unlike convenience food stores, they carry a tremendous number of stock-keeping units which slows their turnover. They are the problem-solving retailers serving the consumer community, carrying lots of repair parts and fix-it items as well as exciting new tools, stylish housewares and hardware, etc. Their average sale is far below that of the other two types of retailers since they carry fewer big-ticket items.
The average size of reporting stores is around 750 m², relatively unchanged over the last four years. In major cities there are hundreds of far smaller hardware stores, but in suburban areas and smaller towns 750 m² would be quite typical.
Sales were essentially flat in 2001 at US $ 1 135 812 on average. Fortunately inventory was reduced on average by five per cent. This may well be a tribute to the gradual computerisation of retailers working together with their primary wholesalers.
A look at DIY lumberyards
DIY lumberyards generate higher sales per m2 of covered sales area and per employee than the hardware stores. They operate with the lowest gross margin and turn their inventory at a very high rate.
The stores are usually situated in outlying locations because they need lots of land and prime retail space is too expensive and unneeded. Their customers are willing to drive a little greater distance for their larger purchases. They realise there will be less variety of products compared to a hardware store or home center, but they know the “basics” will be there in tools, etc. With fewer skus and customers who buy in larger quantities, average sales and store stockturns are both naturally higher.
Productivity
(.pdf download)
These stores do some consumer business, though it often is less than 30 per cent of total sales. They averaged sales floors of about 670 m² plus lots of outside storage areas and sheds for lumber. Reporting stores’ sales averaged US $ 4.6 mio. Inventory held quite flat with previous years.
As the following chart indicates, average sales are much higher than that of the other two retail groups, reflecting their concentration of business with builders, contractors and tradesmen.
A look at home centers
Home centers fit between hardware stores and DIY lumberyards. They operate with margins somewhat higher than the latter, but substantially below those of traditional hardware stores. They turn their stocks faster than hardware stores, too. They enjoy higher average sales because their larger stores permit them to stock larger items such as building materials, cabinets of all kinds and bathroom fixtures. With bigger stores and bigger sales volumes, they tend to promote more heavily and more often and thus seek to create sales rather than rely on consumer “needs”.
Operational data
(.pdf download)
The reporting home centers also had a flat sales year in 2001, but unfortunately increased their inventory by 4.5 per cent. The average size of reporting stores was almost 1 300 m². While industry attention focuses on the three big chains, there are still thousands of smaller home centers. Sales for reporting stores averaged US $ 3.6 mio.
Focus on inventory management
Perhaps the most meaningful statistic is the GMROI, which stands for Gross Margin Return On Inventory. This measures a retailer’s effectiveness in controlling gross margin, sales and inventory management. The figure is reached by multiplying gross margin by sales divided by inventory. For DIY lumberyards, as an example, which has the lowest margin of the three types of retailers, GMROI is highest at $ 1.85. The number means that they generated $ 1.85 for every dollar invested in inventory, which is a store’s biggest investment.
The average size of the reporting hardware dealers is around 750 m².
This is because the DIY lumberyards do a better job of managing (turning) their inventory. GMROI has helped the American hardware industry focus less on gross margin and more on inventory management.